

Key Takeaways
- You can receive Social Security retirement benefits as early as age 62.
- The Social Security full retirement age stands at 65 for individuals born in 1937 and prior, 66 for those born between 1943 and 1954, and 67 for those born in 1960 onwards.
- On average, women have saved 30% less than men by the time they are ready for retirement.
- Over half (59% percent) of workers plan to work in retirement.
Retirement Demographics
Retirement Age
- 64 is the current average retirement age for retirees in the U.S., while the expected retirement age for current workers is 66 years old. Women, on average, retire two years earlier than men.
- The full retirement age is 67 for those born in 1960 or after.
- The retirement age is lowest in Alaska and West Virginia, where people retire at 61 years old on average.
- The retirement age is highest in South Dakota, Massachusetts and Hawaii, where people retire at 66 years old on average.
“This article provides a “snapshot” of retiree finances from a variety of sources. Learning about demographic characteristics of retirees and how others are saving and navigating retirement can help inform how long you continue to work and how and where you save.
No matter what your age, income, gender or race, saving for retirement is important. Your future self will thank you for the money that you set aside today.”
Barbara O’Neill, Ph.D., CFP®, AFC®, CRPC®Owner and CEO of Money TalkWith an extensive 41-year tenure at Rutgers University, Barbara O’Neill has established herself as a highly knowledgeable personal finance expert. As a Certified Financial Planner™ and Accredited Financial Counselor™ professional, she possesses a wealth of expertise in the field. She currently serves as the owner and CEO of Money Talk, where she actively engages in writing, speaking and reviewing personal finance content. In 2020, she notably authored the book Flipping a Switch, delving into various aspects of personal finance.

Global Retirement Statistics
| Country | Normal Retirement Age |
|---|---|
| United States | 66 |
| United Kingdom | 66 |
| Canada | 65 |
| France | 63.8 |
| Greece | 62 |
| Israel | 64.5 |
| Italy | 64 |
| Mexico | 65 |
| New Zealand | 65 |
| Netherlands | 66.6 |
| Japan | 65 |
Women and Retirement
- According to a Bank of America study, the average 401(k) balance was $92,142 in March 2024. Contribution rates were up slightly to 6.6% since 2023.
- According to the same Bank of America study, men continue to rate their feelings of financial wellness higher than women (54 vs 47).
- According to a 2024 New York Life survey, 52% of adults met their savings goal in 2023. On average adults saved $6,138 of their average goal of $7,436.
- Only 57% of women are confident they will meet their financial goals, compared to 75% of men, according to the 2024 New York Life survey.
- 42% of women plan to have less than $3,000 each month in retirement, compared to 27% of men.
- According to the United States Census Bureau, women (50%) are more likely than men (47%) to not have any retirement savings.
- Women also have less in their retirement funds, with only 22% having $100,000 or more saved – whereas 30% of men have more than $100,000 in their retirement savings.
Retirement and Race
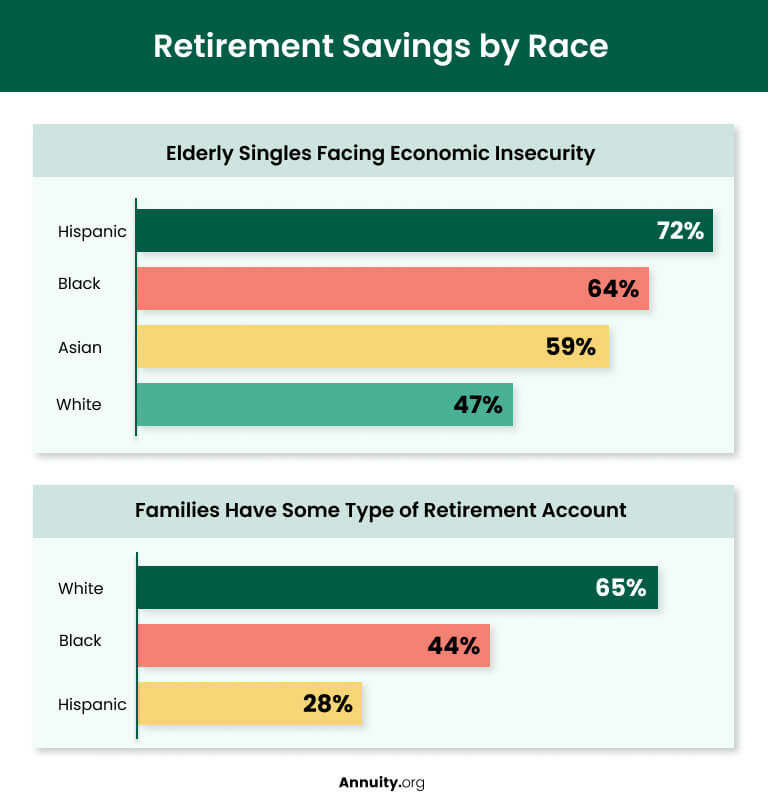
- According to the Fed’s most recent report on disparities in retirement readiness, 51% of Black families have some type of retirement account, compared to 45% of Hispanic families, 75% of Asian families and 68% of White families.
- White and Asian families are nearly twice as likely to feel their retirement savings are on track than Black or Hispanic families.
- Black and Hispanic families have about $45,000 and $62,000 in median wealth, respectively, compared to White and Asian families – who have about $285,000 and $536,000 in median wealth.
- 72% of older Hispanic singles face economic insecurity, compared to 64% of older Black singles, 59% of older Asian singles – and 47% of older White singles.
- About 44% of Black families and 50% of Hispanic families own their primary residence, versus 72% percent of White families.
Retirement Finances
Savings
- According to the most recent data from the Fed, only 31% of non-retirees thought their retirement savings plan was on track in 2023, down from 40% in 2021.
- According to the most recent data from the Survey of Income and Program Participation by the U.S. Census Bureau, at 34.6%, 401(k) style accounts are the most popular retirement savings vehicles among working-age Americans.
- 34% of working-age individuals have an IRA account.
- 20% of working-age individuals have a defined-benefit or cash balance plan.
- According to a 2023 Gallup poll, only 43% of non-retired adults expect to be financially comfortable in retirement.
- 77% of current retirees reported that they have enough money to live comfortably.
- According to the 2023 Gallup poll, 71% of non-retired adults reported moderate worry about their retirement savings, with 42% reporting that they are very worried.
Social Security
- According to the Center on Budget and Policy Priorities, about one in every five U.S. residents (66 million people) received Social Security benefits in June 2023.
- Nine out of ten people over the age of 65 received Social Security benefits in 2023.
- Social Security accounts for about 30% of older adults’ income.
- 37% of men and 42% of women who receive Social Security benefits rely on it for more than half of their income.
- In 2023, retired workers accounted for 77.8% of total benefits paid.
- In 2025, the average monthly Social Security benefit for retired workers was $1,976.
Life in Retirement

Work
- More than half of workers (59%) plan to work in retirement.
- According to a 2022 survey from Edward Jones Financial, 61% of older adults who’ve been retired between zero and two years are interested in working in retirement.
- 10% of older adults who are three to 14 years into retirement report working as one of their favorite activities.
- A 2022 report from Goldman Sachs shows that 34% of retirees prefer working part-time as a means of generating needed income.
Spending
- According to the 2022 Survey by the Employee Benefit Research Institute, approximately half of retirees reported spending less than $2,000 per month.
- Individuals 65 years of age or older spent $52,141 on average in 2021, according to the Bureau of Labor Statistics.
- Retirees reported housing as their largest monthly expense and food as their second largest expenditure.
- 27% of retirees report that their spending amounts are higher than what they can afford.
- Nine out of ten retirees reported inflation as the most common reason why they’ve decreased their spending.
Housing
- In 2021, independent living was the most common type of housing for older adults at 49.8% – followed by 28.8% for nursing care and 21.4% for assisted care, according to Statista.
- According to the National Library of Medicine, nearly 1.5 million older adults currently reside in nursing homes, with 1 million older adults living in assisted living facilities.
- Approximately 33% of older adults will live in a nursing home at some point in their life, according to Health In Aging.
My position was eliminated after 21 years of progressively responsible employment in 2021. I am 64, and after 9 months in the job market, I’m leaning toward early retirement. I was planning on retiring at 66, but after reading this article, I’m not retiring so ‘early.’ I like reviewing stats. This article was helpful in analyzing my current situation.
Editor Malori Malone contributed to this article.